
Information Center
Your Health. Your Family. Your Choice.
|
|
National Vaccine Information Center Your Health. Your Family. Your Choice. |
The MedAlerts Blog |
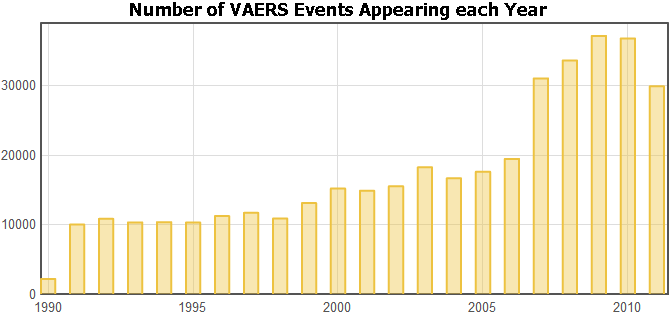
Another year of VAERS data has been published by the government, so it's time for a yearly wrap-up. As I have done in past years, I will look at the number of VAERS events that have been posted since the start of the program in 1990. The search is simple: a Graph of Year of Appearance (the year in which a particular VAERS event appeared in the data):
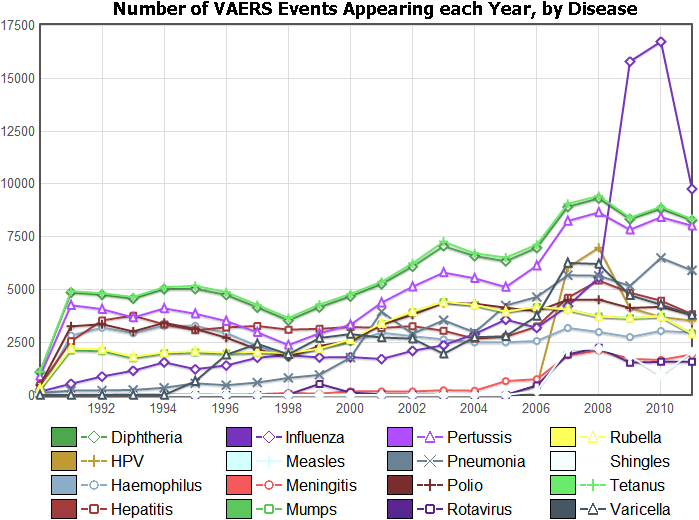
What changed? Let's look at individual vaccines. Make a Graph of Year of Appearance and Vaccine Type (the Vaccine Type is the disease that the vaccine prevents).
Of course, when looking at yearly Flu seasons it is important to note that they occur in the winter months, which span two different calendar years. So it is more useful to graph Month of Appearance instead of Year of Appearance. Doing that for the past few years confirms the decrease in Flu-related VAERS events during this current Flu season:
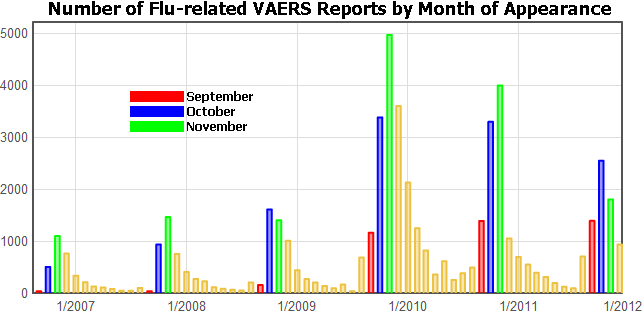
Of course, the number of Flu-related VAERS events rose significantly in the previous two years, no-doubt fueled by the H1N1 scare, so this may simply be the "normalizing" of an unusual spike. But Flu shots are still pushed hard during the winter months and many people still get the vaccination.
Is the decrease in the number of Flu-related VAERS reports caused by a safer Flu vaccine? Has the unusually late Flu season resulted in people avoiding the shot until 2012, leaving 2011 numbers low? Or are people intentionally avoiding getting the Flu vaccine?
<< 11/2011: Pregnant women and HPV 1/2012: Seizures and 5-in-1 Vaccines >>
Copyright ©
2026 National Vaccine Information Center. All rights reserved.
21525 Ridgetop Circle, Suite 100, Sterling, VA 20166