
Information Center
Your Health. Your Family. Your Choice.
|
|
National Vaccine Information Center Your Health. Your Family. Your Choice. |
The MedAlerts Blog |
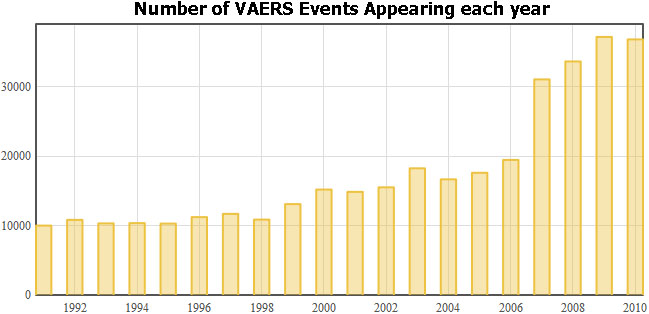
2010 is over and complete VAERS data for the year has been published by the government. Since 1990, when VAERS began, the number of reports added each year has almost always gone up. But not this year. In 2010, there were 36,818 new reports added, whereas 2009 had an all-time high of 37,181 (really, not very different).
Here is a graph of the number of VAERS events released each year. To see this for yourself, click Show Graph (in Section 1) and graph Year of Appearance.
The numbers do not show that.
The CDC reports that in the 2005-2006 Flu season, about 30% of adults (age 18-49) got the vaccination. Older people got it at higher rates (36% of 50-64 year olds and 69% of people 65 and over). Further, they claim that this figure was a drop of about 5% from the 2003-2004 season. Other reports on the web confirm that about 1/3 of adults get a Flu shot in a typical year.
And what about the 2009-2010 Flu season? The Rand Corporation estimates that during last year's Flu season, 39% of adults were vaccinated, which is only a small increase over typical years.
So it is not reasonable to blame the rise in adverse events following the Flu shot on the increased number of people getting it. There must be some other explanation.
One explanation for the rise in the number of Flu reactions is that during the 2009-2010 Flu season, people got two shots, for both Seasonal Flu and H1N1 Flu. Of course, that would only account for a factor of two rise, not a factor of three. Also, not everybody got two shots. Let's graph the three main Flu vaccinations that were reported in the past two years. The red line is Seasonal Flu, the purple line is the H1N1 Flu, and the green line is this year's Seasonal Flu (which has H1N1 in it).
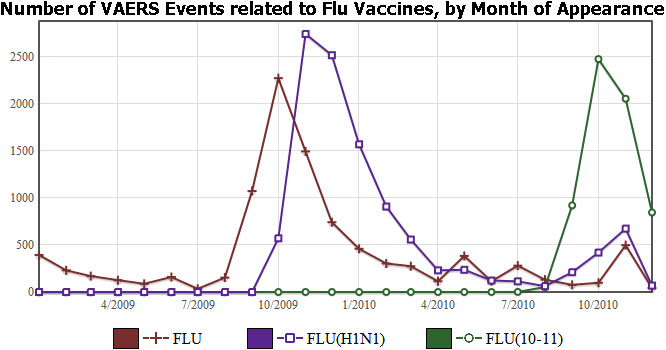
Something is causing an increase in the number of reactions to the Flu shot, and it isn't just that more people are getting it. We should all wonder why nearly half of recent VAERS reports involve people who have gotten a Flu shot.
<< 9/2010: H1N1 Flu and miscarriages 1/2011: Guillain-Barré Syndrome >>
Copyright ©
2026 National Vaccine Information Center. All rights reserved.
21525 Ridgetop Circle, Suite 100, Sterling, VA 20166