
Information Center
Your Health. Your Family. Your Choice.
|
|
National Vaccine Information Center Your Health. Your Family. Your Choice. |
The MedAlerts Blog |
I want to acknowledge the efforts of the people who work at VAERS, a joint program of the CDC and the FDA.
Those in the anti-vaccination community often complain about the "lobby-controlled government," and those in the pro-vaccination community complain about the validity or usefulness of VAERS data. Caught in the middle are the people working at VAERS who have the thankless job of collecting and distributing this information.
This month, I will give three kudos to the people at VAERS.
Kudo #1: Excellent phone support. Call their toll-free phone number, as I have done, and you will quickly speak to a knowledgeable representative. Not only are they well-trained in the VAERS system, but they are determined to find answers to your questions. One agent even called me back later after having investigated my question in detail.
Kudo #2: Enhanced data distribution during Flu season. For decades, the VAERS people made monthly releases of their data. Then, last year during the H1N1 Flu season, they switched to making weekly data releases. This continued until Flu season ended and then went back to monthly. And this year they once again made weekly releases of data during Flu season. People at VAERS put in extra effort with Flu data.
Kudo #3: Rapid turnaround of HPV data. It is my belief that the people at VAERS are also determined to respond rapidly to reports of HPV (Human Papillomavirus) vaccine damage. I will support this belief with the following analysis of the VAERS data.
In my August, 2010 report, I discussed the notion of the onset interval, the number of days between taking a vaccination and getting adverse symptoms. But VAERS reports have up to five different dates, which allows for many different intervals:
To do this search, start by checking Expert Mode in the upper-right (to work with all of the different dates and intervals). Then make a Graph of Submission-to-Appearance and Vaccine Type (in Section 1). This is what you get:
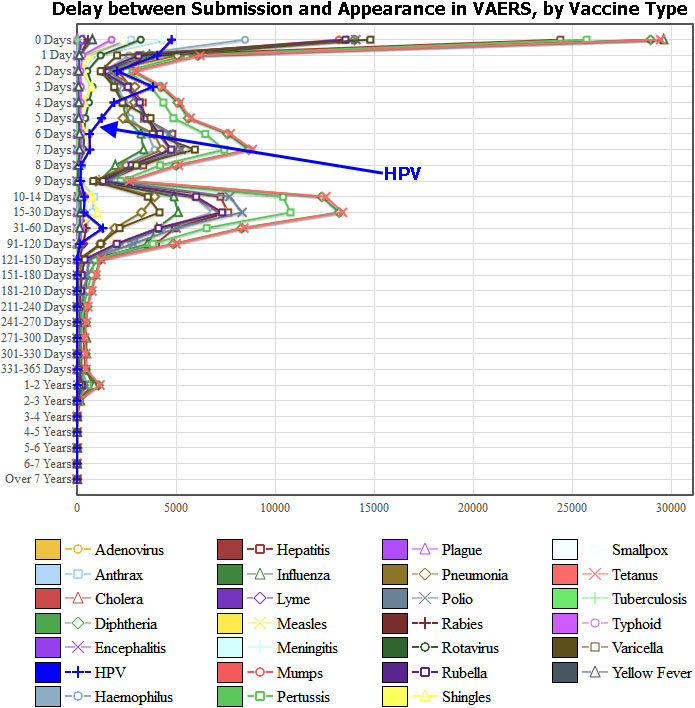
But look at the graph for the HPV vaccines (highlighted in blue). These reports have no 1-week or 1-month peak: they are processed much more quickly than all other VAERS reports, usually within 3 days of submission.
So kudos to the people doing the work at VAERS: they care about getting the data out to us, and deserve our thanks.
<< 1/2011: Guillain-Barré Syndrome 3/2011: Gender and VAERS data >>
Copyright ©
2026 National Vaccine Information Center. All rights reserved.
21525 Ridgetop Circle, Suite 100, Sterling, VA 20166